Every Monday morning, an account manager opens a spreadsheet, logs into Meta Ads Manager, and starts copying numbers into a Google Doc. Two hours later, one report is done. Seven more to go.
This ritual is not just tedious. It is actively harmful. Every hour pulling numbers is an hour not spent on strategy --- the thing clients actually pay for. And most of those meticulously crafted reports get skimmed for 90 seconds and never opened again.
The Real Cost of Manual Reporting
A single weekly report takes 90 minutes to three hours. At 10 clients, that is 15 to 30 hours per week --- $3,000 to $6,000 per month on telling clients what happened instead of making better things happen.
The indirect costs are worse: context switching between platforms, inconsistency across AMs, staleness (data is 3-5 days old by delivery), and insight deficit (80% of effort goes to data assembly, leaving 20% for analysis).
What Clients Actually Want
Clients want answers to three questions:
- Is my money working? Are we hitting targets?
- What changed? What improved or broke since last period?
- What are you doing about it? Not what happened, but what happens next.
A 30-slide deck with every metric for every campaign is not informative. It is overwhelming. The best reports are short, opinionated, and action-oriented.
The Anatomy of a Report That Works
Executive Summary. Three to five bullets. Spend. Revenue. ROAS. The win. The concern. If a client reads nothing else, this tells them where they stand.
KPI Scorecard. The metrics that matter, with period-over-period comparison and color coding: green for improvements, red for declines.
| Metric | This Week | Last Week | Change | |---|---|---|---| | Spend | $48,714 | $45,201 | +7.8% | | Revenue | $92,103 | $83,450 | +10.4% | | ROAS | 1.89x | 1.85x | +2.2% | | CPA | $42.62 | $44.18 | -3.5% |
Drivers. The two or three things that had the biggest impact --- positive and negative. This is the analysis clients pay for.
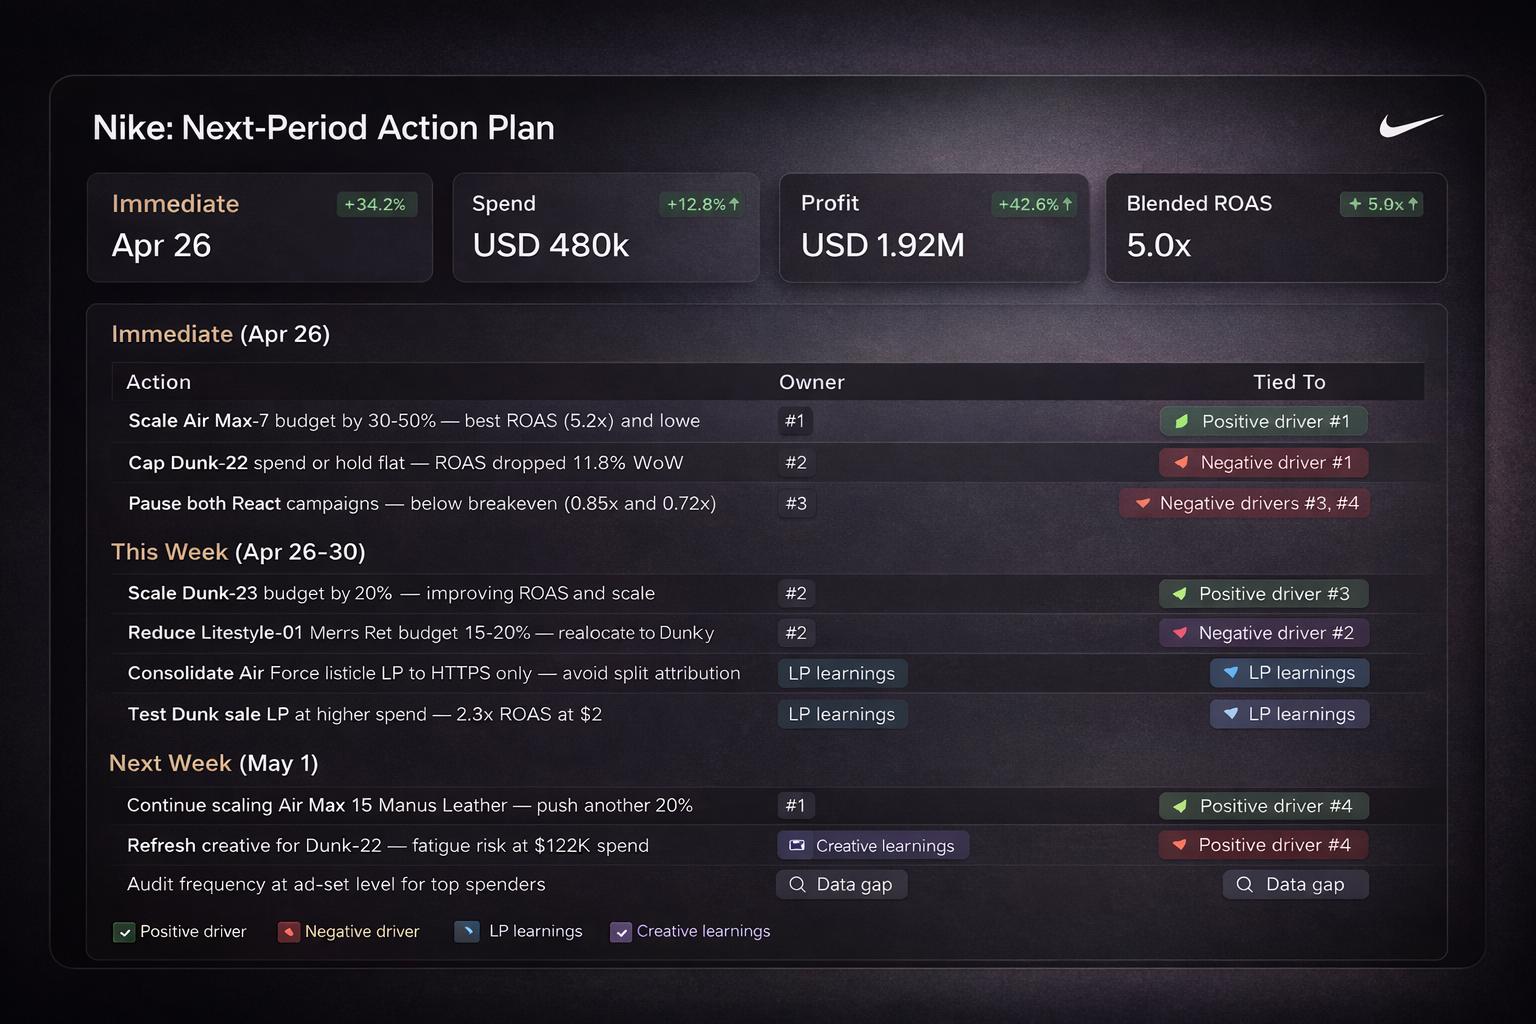
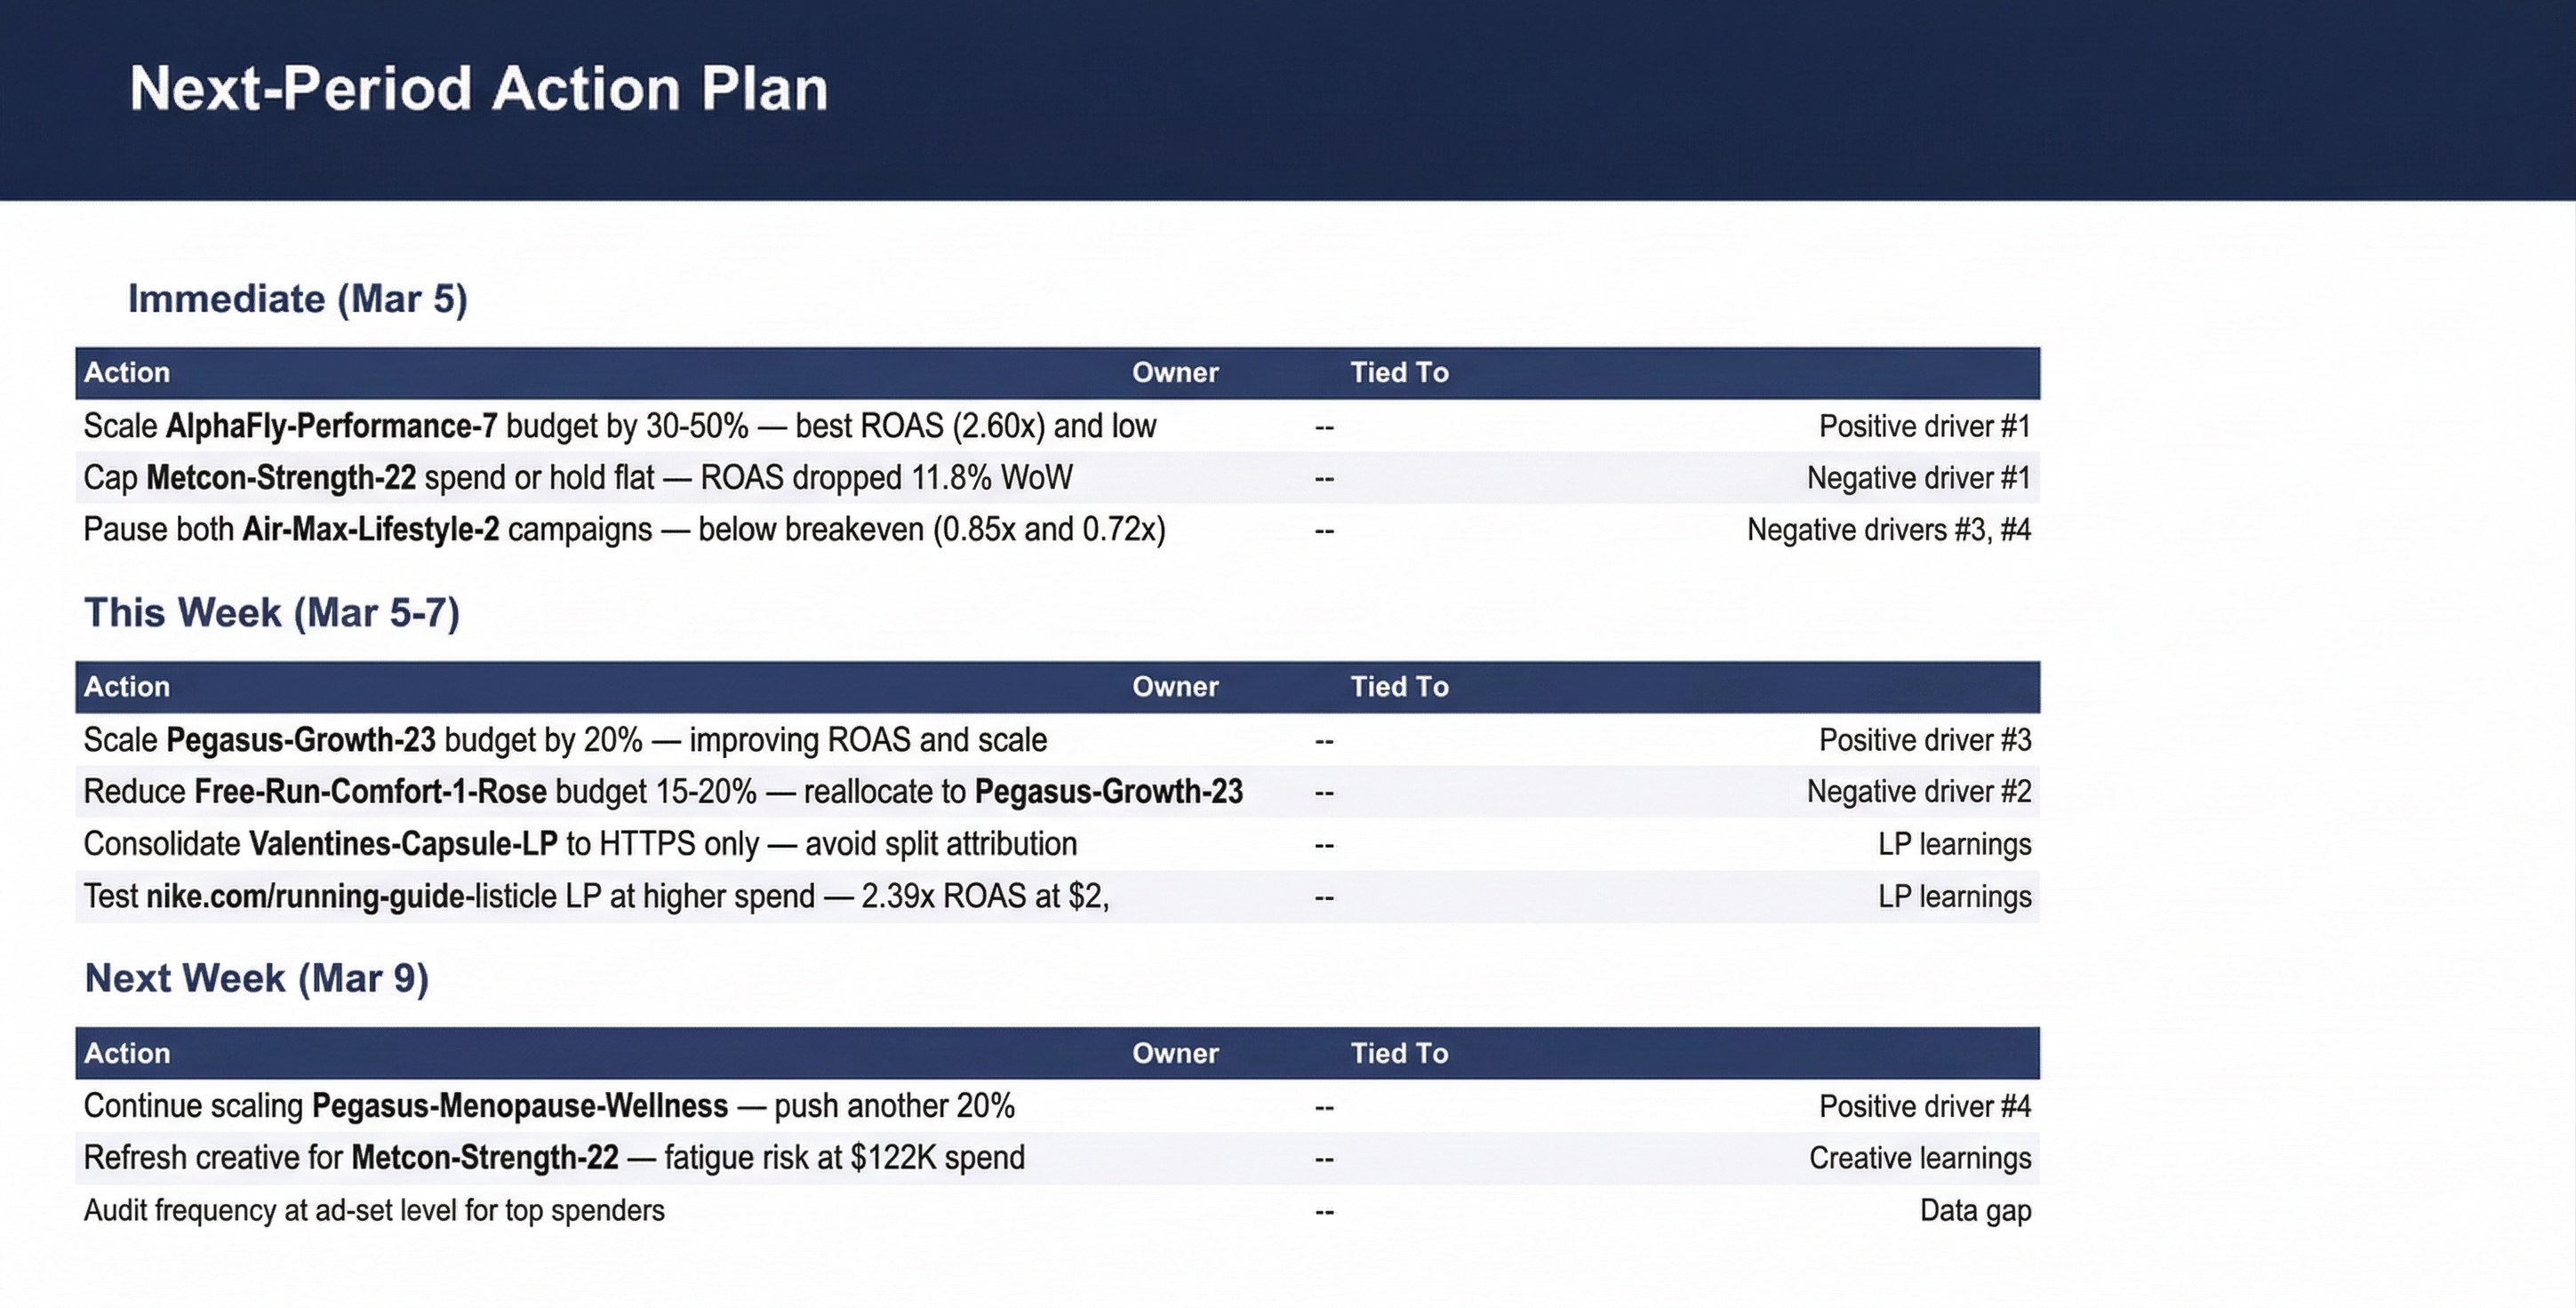
Action Plan. Specific, time-bound actions. Not "optimize campaigns" but "pause Campaign Y ad set 3, launch three new creatives targeting Audience B."
What This Looks Like With Glued MCP
Using Glued's MCP API and AI-powered reporting skills, this entire report builds itself from live ad account data. Here is what an automated weekly report looks like --- complete with narrative, scorecard, driver analysis, and a styled 10-slide PDF deck:
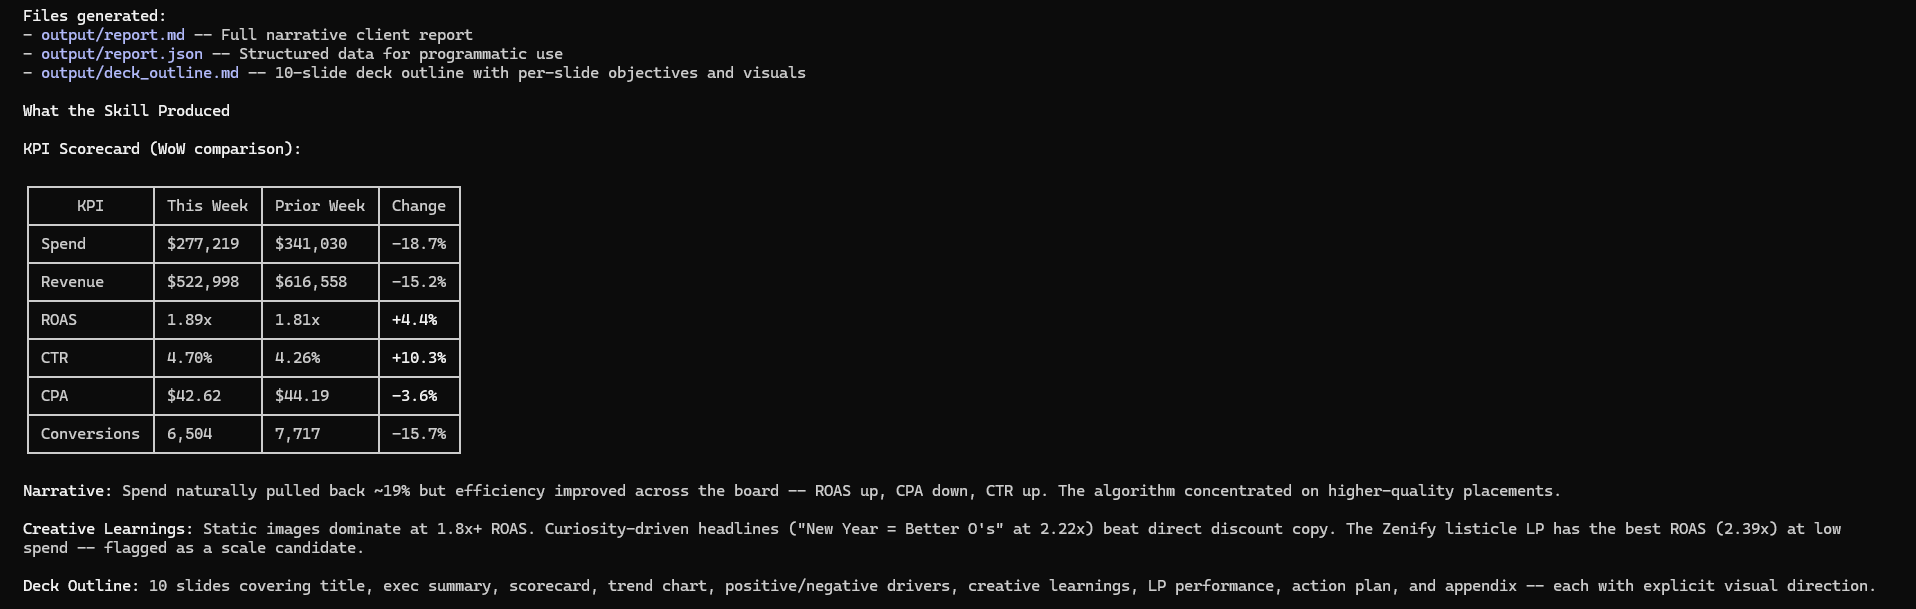
In a recent run, the system pulled $341K in spend across 10 accounts, computed 1.81x blended ROAS, identified top 6 campaigns by spend, ranked creatives and landing pages by performance, and generated a 10-item action plan --- all structured into a client-ready deck.
Automating the Data Layer
The solution is separating work into two layers:
Layer 1: Data assembly. Pulling metrics, computing period comparisons, ranking campaigns, formatting tables. Mechanical work that should be automated.
Layer 2: Strategic narrative. Interpreting data, connecting trends to business context, recommending next steps. This is where your team should spend time.
When you automate Layer 1, your AM spends 20 minutes reviewing and adding narrative instead of two hours assembling data.
The PDF Deck
Some clients want a proper presentation. Building these manually is where time really explodes. Automated deck generation produces a styled landscape PDF with title slide, executive summary, KPI scorecard, account table, driver breakdowns, creative learnings, action plan, and appendix --- consistent across every client, every week.
Building the Reporting Cadence
Daily digests (automated). Slack summary of yesterday's performance. Replaces the "how did yesterday go?" interruption.
Weekly reports (automated data + human narrative). Scorecard, drivers, creative learnings, action plan. Data automated, narrative takes 15-20 minutes.
Monthly deep dives (human-led). Trend lines, strategic recommendations, forward-looking plans. Where senior strategists add the most value.
80 percent of reporting volume (daily and weekly) should be heavily automated. That frees your team for the 20 percent where human insight creates the most value.
The Competitive Advantage of Speed
The agency that delivers reporting first wins. When your report is in the client's inbox Monday morning before their team opens Ads Manager, you look proactive. When they chase you for numbers by Wednesday, you look overwhelmed.
Speed comes from systems that eliminate the lag between data availability and insight delivery. Clients trust agencies that are consistently ahead of them on the data. That trust leads to bigger budgets and longer retainers.
Ready to automate your client reporting? Glued's MCP API powers AI-driven report generation with multi-account data pulls, period comparisons, creative analytics, and styled PDF deck exports. Start your free trial at glued.me and give your team their Mondays back.