Every growth team says the same thing in job postings, pitch decks, and Slack channels: "We're data-driven." Then you watch them build ad creative and the data disappears entirely.
The media buyer pulls last week's numbers into a spreadsheet. A strategist writes a brief based on gut feel and whatever the competitor is running. A designer produces three variations with no knowledge of what performed last month. The ads go live. Everyone waits. The cycle repeats.
That is not a data-driven creative workflow. That is a data-adjacent one. And the gap between those two things is costing you real money.
The Illusion of Data-Driven Creative
Let's be blunt. Having data does not make you data-driven. Having data and actually using it to make creative decisions in real time does.
Most performance marketing teams have more data than they know what to do with. Meta Ads Manager alone surfaces hundreds of metrics per campaign. Google Ads adds another layer. Your analytics stack adds another. The data is not the problem.
The problem is that data lives in dashboards that only one or two people check. It gets summarized into weekly reports that arrive two days too late. It gets filtered through human interpretation before it ever reaches the person designing the next ad.
Here are the symptoms:
- Your creative team produces new ads based on verbal direction like "make it feel more premium" instead of performance data.
- Nobody can answer "which hook style has the best hold rate across our last 30 video ads" without building a spreadsheet from scratch.
- Performance reviews happen weekly, but creative decisions happen daily, so the feedback loop is already broken.
- Your highest-performing ad from three months ago has no documented record of why it worked.
If any of those sound familiar, your workflow is broken. Not because your team is bad, but because the infrastructure between data and creative production does not exist.
The Three Broken Handoffs
The data-driven creative workflow fails at exactly three handoff points. Each one introduces delay, distortion, or both.
Handoff 1: Data Team to Strategy
Raw performance data gets exported from ad platforms. A media buyer or analyst spends hours cleaning it, pivoting it, and trying to extract insights. Those insights get compressed into a summary like "static images are outperforming video this week" and passed to the creative strategist.
What gets lost: granularity. The strategist does not see that one specific visual style in static images is carrying all the performance. They do not see that the video underperformance is driven by a single audience segment. They get a headline, not the story.
Handoff 2: Strategy to Creative
The strategist writes a brief. The brief describes the concept, the target audience, maybe a reference or two. The designer or editor receives it and produces work based on their interpretation of the brief.
What gets lost: context. The designer never sees the actual ad performance data. They never see which color palettes drove engagement, which text overlays held attention, which aspect ratios delivered better ROAS. They are working from a telephone-game version of the original signal.
Handoff 3: Creative Back to Data
New ads go live. Performance data starts flowing. But that data is not connected to the creative decisions that produced the ad. There is no structured way to say "this ad used Hook Style A with Color Palette B and CTA Placement C, and here is how it performed relative to every other combination."
What gets lost: the feedback loop itself. Without structured creative metadata linked to performance outcomes, every new round of creative starts almost from zero. You have pattern recognition in people's heads, but nothing systematic.
Why Spreadsheets Kill Creative Velocity
The default tool for bridging this gap is the spreadsheet. A shared Google Sheet where someone manually logs ad creatives, their attributes, and their performance metrics.
It works for a week. Maybe two. Then it breaks.
Spreadsheets fail for creative workflows because:
- They require manual entry. Every new ad needs someone to log it, tag its attributes, and update performance data. Nobody does this consistently at scale.
- They cannot display creative assets. A spreadsheet can tell you that Ad 47 had a 3.2x ROAS. It cannot show you what Ad 47 looked like next to Ad 48 with a 1.1x ROAS so you can visually compare them.
- They are static. Performance data changes daily. A spreadsheet is a snapshot. By the time you update it, the decisions it should have informed are already made.
- They create bottlenecks. Only the person who built the spreadsheet truly understands it. When they are out, the process stalls.
The result is a creative team that moves at the speed of spreadsheet maintenance, not at the speed of the market. Your competitors who ship 50 new creatives a week are not doing it because their designers are faster. They are doing it because their feedback loop is tighter.

What a Truly Data-Driven Creative Workflow Looks Like
A real data-driven creative workflow is not about dashboards. It is about removing the distance between performance insight and creative action.
Here is what it looks like in practice:
Performance data is visual, not tabular. Creative teams do not think in rows and columns. They think in images, videos, and layouts. The data layer must present performance metrics alongside the creative asset itself so that a designer can see spend, ROAS, CTR, and the actual ad in a single view.
Creative attributes are structured, not anecdotal. Every ad gets tagged, whether by AI or by a human process, with its component attributes: hook type, visual style, CTA placement, color palette, format. This turns unstructured creative output into queryable data.
The feedback loop is continuous, not weekly. Performance signals flow back to the creative team in near real time. When a hook style starts fatiguing, the team sees it within the day, not at the next Monday standup.
Iteration is systematic, not random. Instead of producing new creative from scratch every cycle, the team uses performance data to identify what is working and generates variations on winning elements. This is not about killing creativity. It is about giving creativity a foundation of evidence.
Anyone can ask questions and get answers. A creative strategist should be able to ask "show me our top 5 video hooks from the last 60 days by hold rate" and get an answer in seconds, not hours. When the barrier to insight is low, the team uses it constantly.
The Role of AI in Closing the Creative Analytics Gap
AI is not a magic fix for broken workflows, but it is a powerful accelerator when the workflow is structured correctly.
There are three areas where AI changes the game for data-driven creative:
Creative analysis at scale. Manually reviewing hundreds of ad variations to identify patterns is not realistic. AI can analyze visual and textual elements across your entire ad library, detect patterns in what drives performance, and surface insights that would take a human analyst weeks to compile.
Variation generation from performance data. Once you know which visual elements are working, AI can generate new variations that preserve winning attributes while exploring adjacent creative territory. This is not about replacing designers. It is about giving them a head start rooted in data.
Natural-language access to insights. The biggest friction in data-driven creative work is the query barrier. If getting an answer requires SQL, or a custom dashboard, or three Slack messages to the analytics team, people stop asking questions. Agentic AI copilots that let anyone on the team ask performance questions in plain language remove that friction entirely.
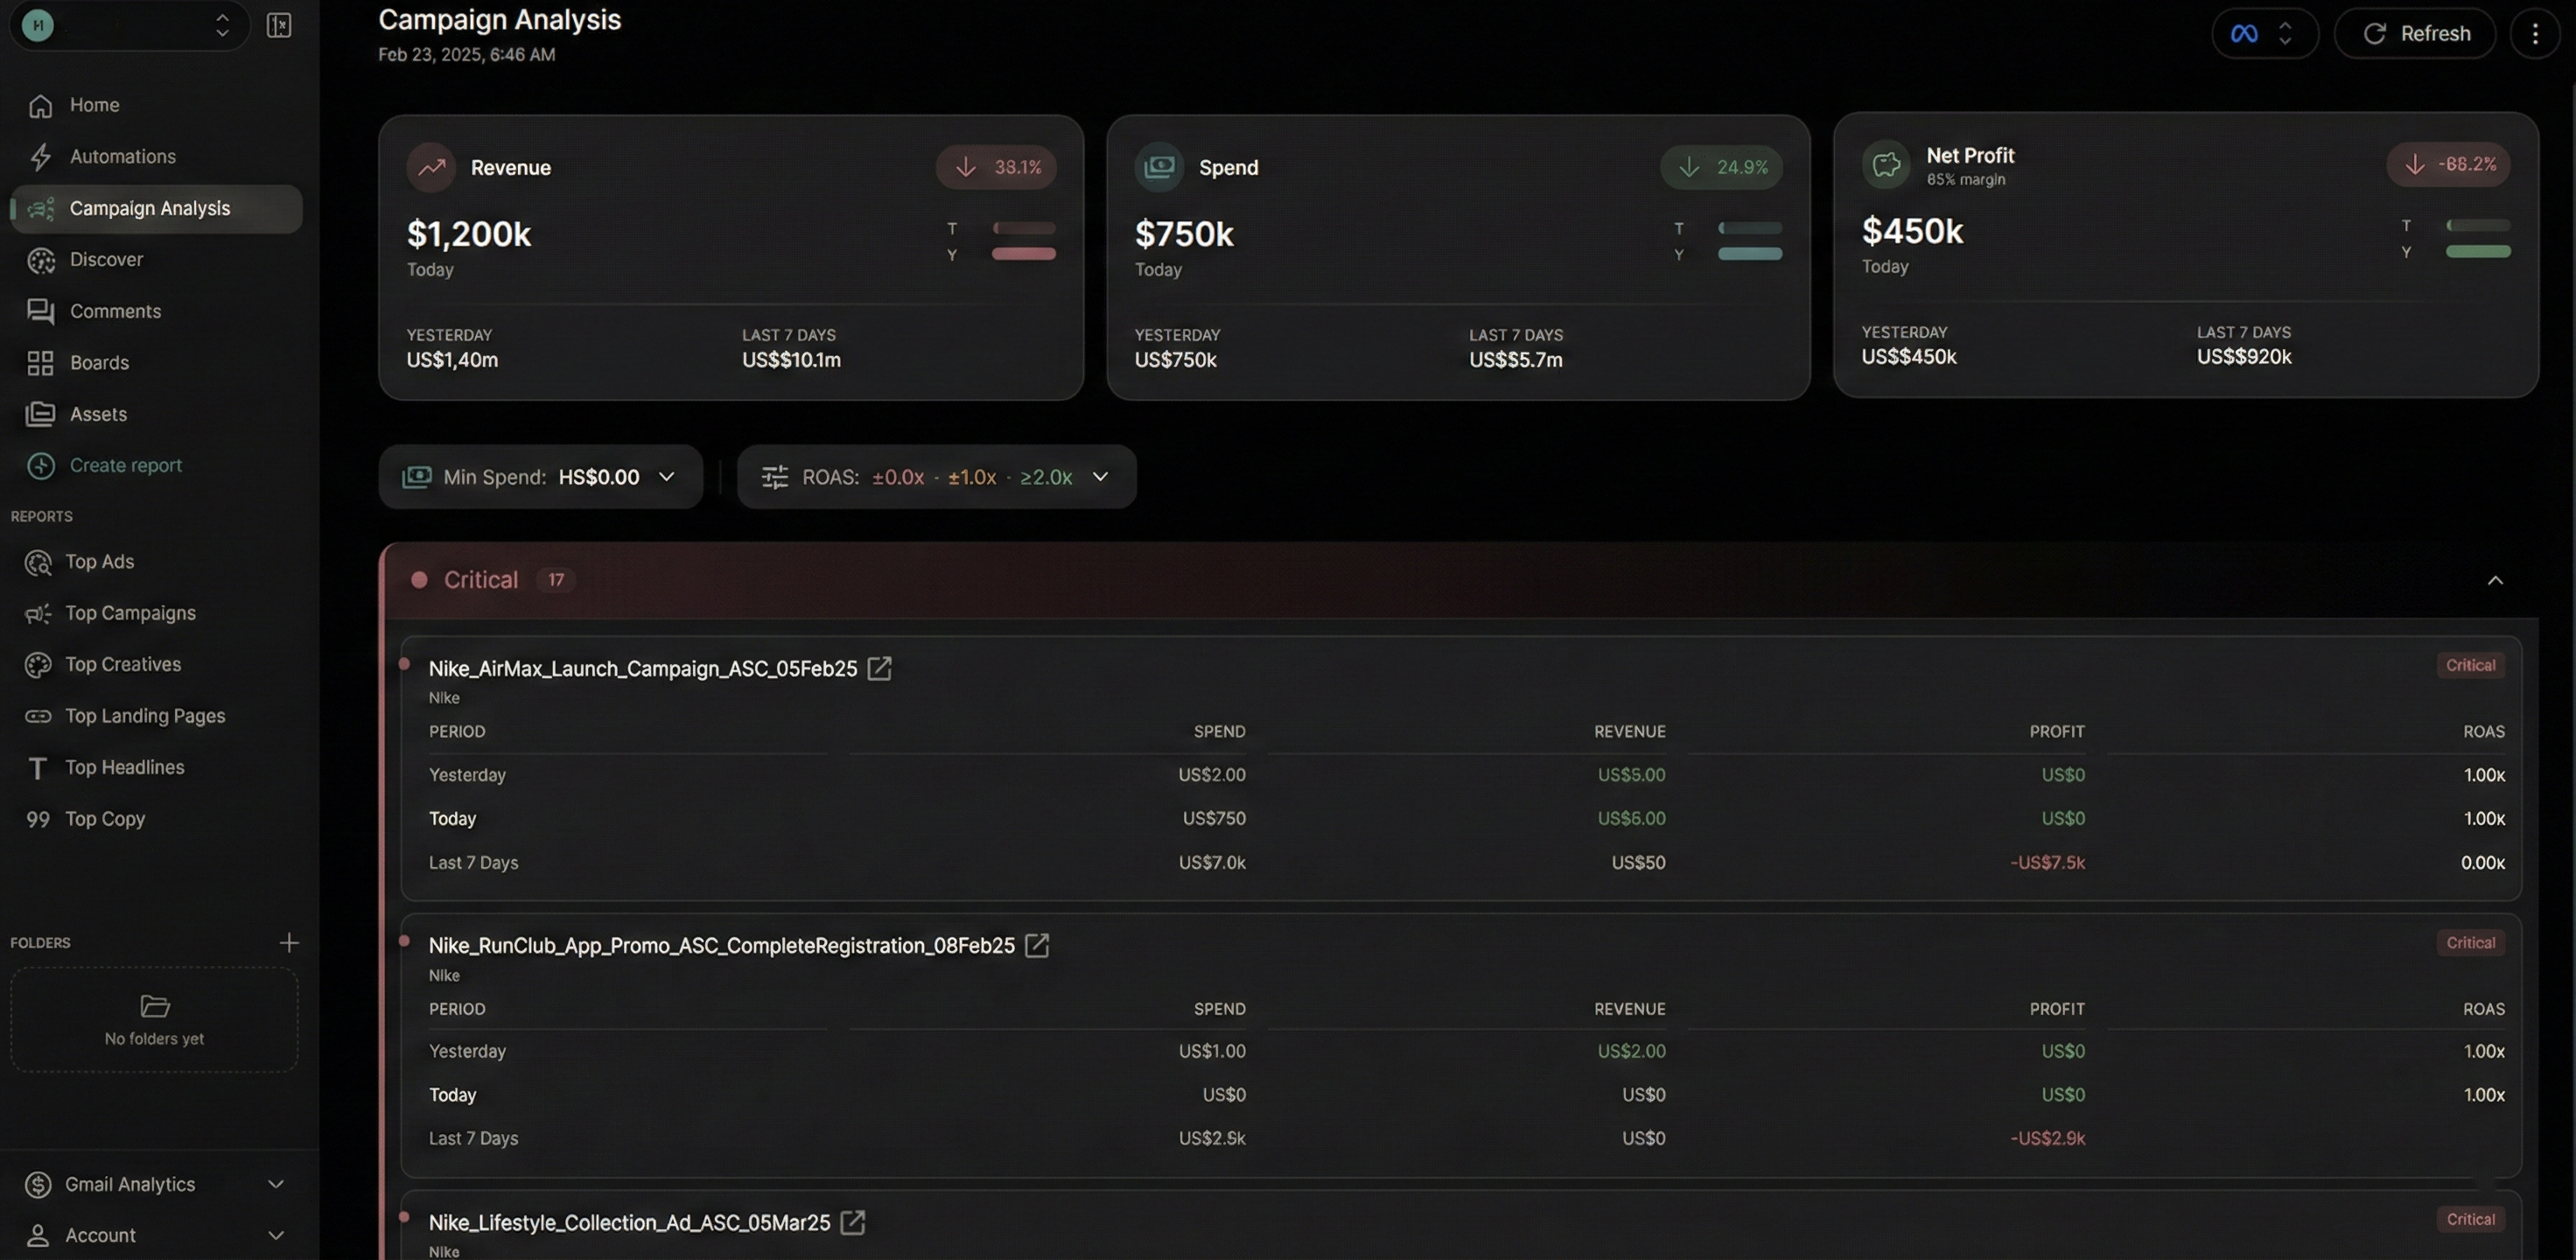
Platforms like Glued are built around this premise: overlay spend and ROAS directly on creative thumbnails, use AI to analyze video hooks and generate image variations from reference ads, and provide a copilot that answers campaign questions in natural language. The goal is not to add another dashboard to the stack. It is to make the data disappear into the creative workflow itself.

Building the Feedback Loop: A Practical Framework
If your current workflow is broken, you do not need to rebuild everything at once. Start with the feedback loop. Once performance data reliably flows back into creative production, the rest follows.
Here is a step-by-step approach:
- Centralize your creative library with performance data attached. Every ad asset, across Meta and Google, should live in a single view with its performance metrics. No more switching between platform dashboards.
- Tag creative attributes systematically. Define the dimensions that matter for your brand: hook type, visual style, offer framing, CTA treatment, format. Tag retroactively if needed. AI tagging tools can accelerate this.
- Replace the weekly creative review with a continuous signal. Set up alerts for creative fatigue, performance anomalies, and winning patterns. Route them to where your team works, whether that is Slack, email, or a shared workspace.
- Brief from data, not from memory. Every creative brief should reference specific performance data: "Hook style X has a 40% higher hold rate. Palette Y drives 2x CTR in this audience segment. Build variations on these foundations."
- Close the loop with structured measurement. When new creative goes live, track it against the hypotheses embedded in the brief. Did the data-informed variation outperform the control? Feed that result back into the system.
- Lower the barrier to insight. If only your media buyer can pull performance data, the loop will always be slow. Give the whole team access through tools that require zero technical skill to query.
This is not a six-month transformation. Teams that commit to this framework see results within weeks because the core change is not technological. It is cultural. It is the decision to stop treating performance data and creative production as separate functions and start treating them as a single, continuous loop.
The Bottom Line
Calling yourself data-driven while your creative team works from vibes and verbal briefs is not a strategy. It is a liability.
The teams that win in performance marketing over the next two years will not be the ones with the biggest budgets or the fanciest creative talent. They will be the ones who close the gap between what the data says and what the creative team builds, faster and more consistently than anyone else.
The infrastructure to do this exists today. The question is whether your team will adopt it or keep pretending that a spreadsheet and a Monday standup constitute a feedback loop.
Glued helps performance marketing teams bridge the gap between ad data and creative production with cross-channel analytics, creative performance overlays, AI-powered iteration tools, and a natural-language copilot. [See how it works](https://glued.me).