You can have the most compelling offer in the world, but if your video ad can't stop the scroll and keep attention, none of it matters. Two metrics separate winning creatives from wasted spend: hook rate and hold rate.
Most creative strategists track one or the other. The best track both together — and use the relationship between them to diagnose exactly where a creative is breaking down.
This guide breaks down what each metric means, how to calculate them, what good looks like, and how to use the two together as a diagnostic framework for every video ad you launch.
What Is Hook Rate (Thumb-Stop Rate)?
Hook rate measures the percentage of people who stopped scrolling and watched the first few seconds of your video ad. It's also called thumb-stop rate or stop rate across different platforms and teams.
The standard calculation:
Hook Rate = (3-Second Video Views / Impressions) x 100
Some teams use 2-second views instead of 3, depending on the platform. Meta reports both. The logic is the same: out of everyone who saw your ad in their feed, how many actually paused long enough to register the opening?
A strong hook rate tells you the first frame, the first motion, and the first second of audio (if any) are doing their job. A weak hook rate means your creative is invisible — it blends into the feed and gets scrolled past before anyone processes what they're looking at.
Hook rate is entirely about the opening. It says nothing about what happens after someone stops.
What Is Hold Rate (Watch-Through / Retention Rate)?
Hold rate measures how much of your video people actually watch after they've been hooked. It's sometimes called watch-through rate, retention rate, or completion rate, depending on context.
The standard calculation:
Hold Rate = (ThruPlays or 15-Second Views / 3-Second Video Views) x 100
On Meta, a ThruPlay counts when someone watches at least 15 seconds (or the full video if it's shorter than 15 seconds). So hold rate tells you: of the people who stopped scrolling, what percentage stayed for a meaningful portion of the ad?
You can also calculate hold rate at other intervals — 25%, 50%, 75%, 100% completion — to build a full retention curve. But the 3-second-to-15-second ratio is the most actionable starting point.
A strong hold rate means your content delivers on the promise of the hook. A weak hold rate means people stopped, looked, and bounced — the classic "great thumbnail, bad movie" problem.
Why Both Metrics Matter Together
Hook rate and hold rate are two halves of the same story. Optimizing for one without watching the other leads to bad creative decisions.
A viral-style hook might spike your thumb-stop rate, but if the rest of the ad doesn't connect, you've just paid for three seconds of attention that never converts. Conversely, a beautifully paced product story means nothing if nobody sticks around past the first frame.
The real insight comes from reading both metrics as a pair. They form a diagnostic matrix that tells you exactly what to fix.
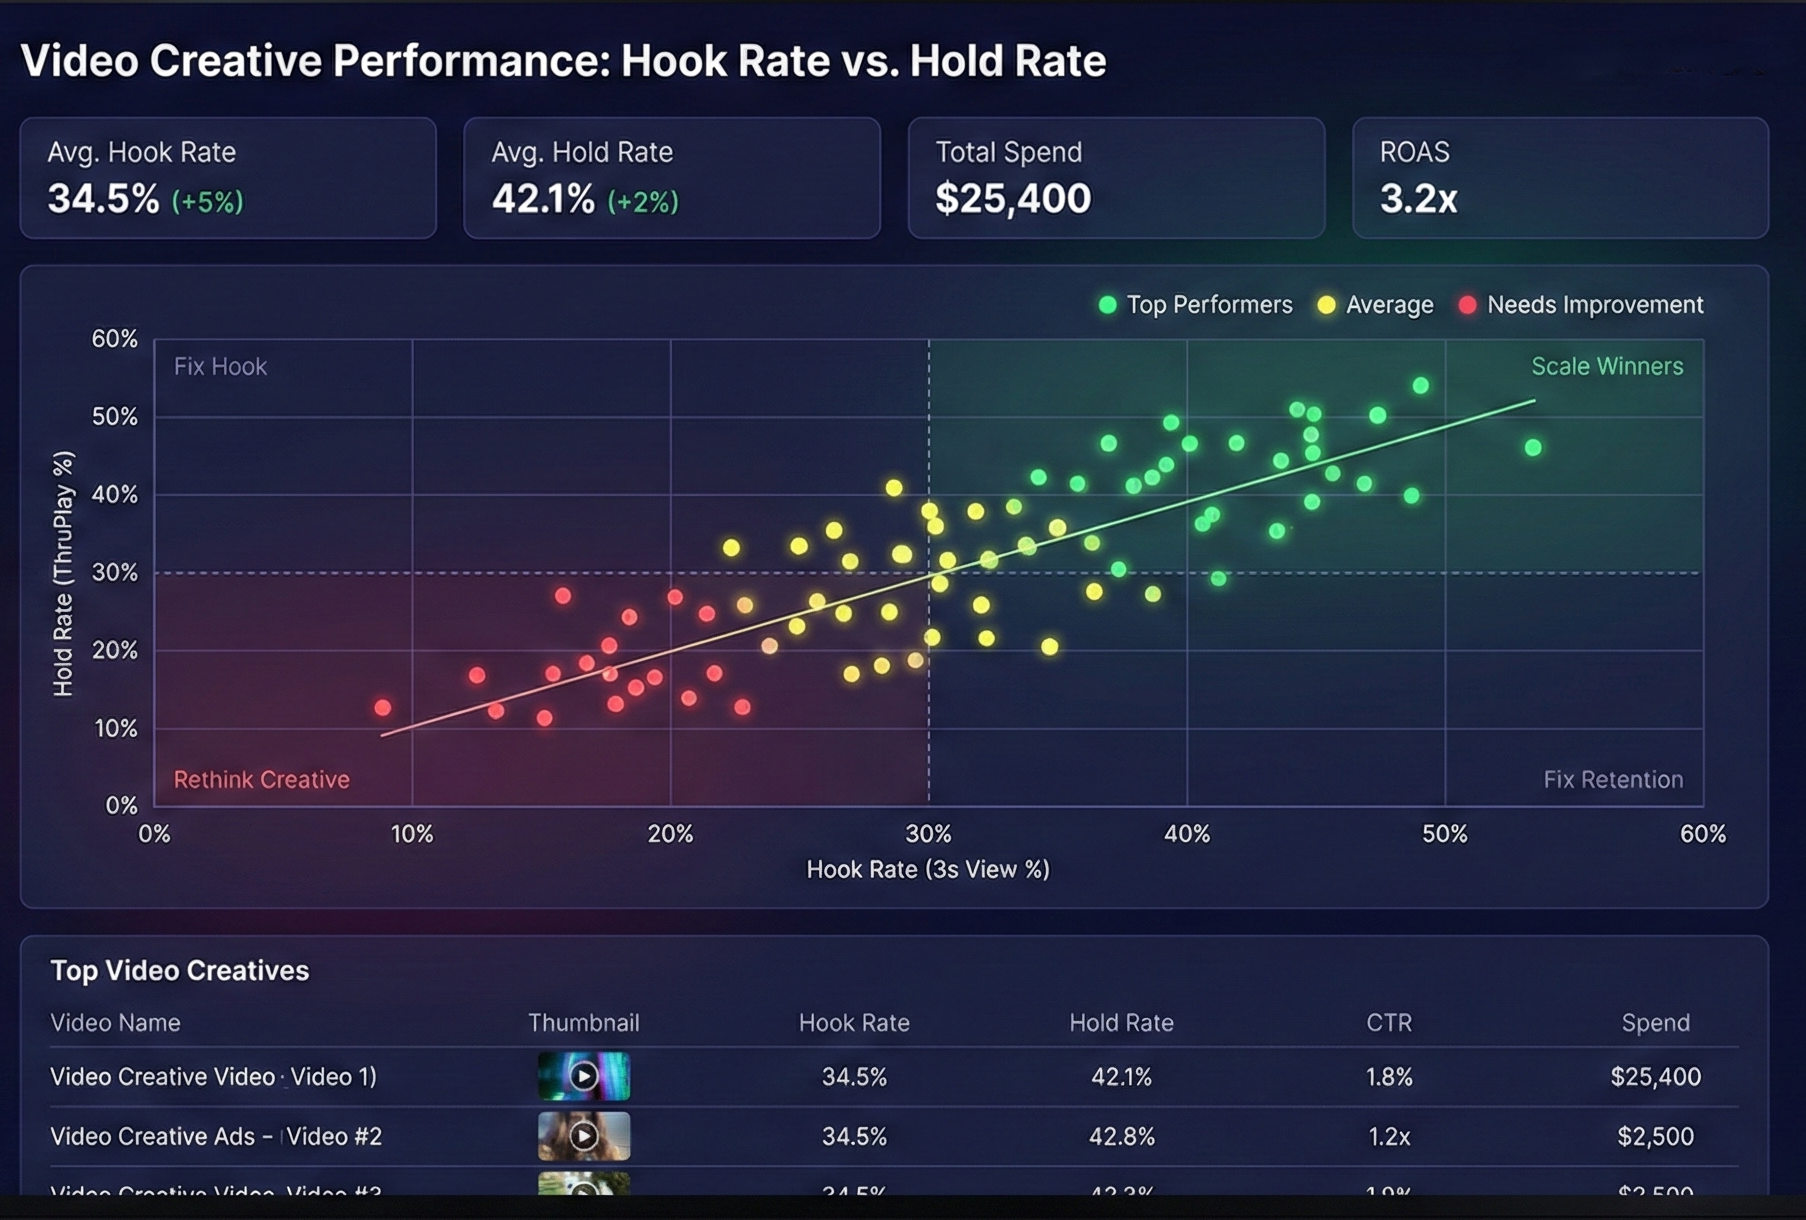
The Diagnostic Framework: Reading Hook Rate and Hold Rate Together
This is the framework that changed how our team thinks about creative iteration. Plot your video ad into one of four quadrants:
High Hook Rate + High Hold Rate = Winner
Your creative stops the scroll and keeps attention. This is your control ad. Scale spend, test new audiences, and build variations off this structure.
Action: Don't touch the creative. Test it in new placements and audiences. Use it as a template for future concepts.
High Hook Rate + Low Hold Rate = Bait and Switch
People stop scrolling but leave quickly. The opening is doing its job, but the body of the ad fails to deliver. Common causes:
- The hook promises something the ad doesn't pay off
- Pacing drops after the first 3 seconds
- The value proposition is unclear or arrives too late
- The middle section feels like filler
Action: Keep the hook. Rebuild the body. Tighten pacing, move the CTA or key benefit earlier, and cut anything that doesn't directly support the message.
Low Hook Rate + High Hold Rate = Hidden Gem
The people who do watch love it — but not enough people are stopping in the first place. This is the most frustrating (and most fixable) scenario.
- The opening frame is visually bland or generic
- There's no pattern interrupt in the first second
- The hook doesn't create curiosity or tension
- Text overlay is too small or absent
Action: Keep the body. Replace the first 1-3 seconds with a stronger hook. Test multiple opening variations against the same body content.
Low Hook Rate + Low Hold Rate = Back to the Drawing Board
Neither the opening nor the content is working. This creative needs a full rethink, not incremental edits.
Action: Archive it. Go back to the brief. Study what's working for competitors and in your own top-performing ads before rebuilding from scratch.

Benchmarks: What Good Looks Like
Benchmarks vary by platform, industry, and ad format. These ranges are based on aggregated performance data from paid social campaigns and should be treated as starting points, not absolutes.
Hook Rate Benchmarks
- Strong: 30%+ (your creative is genuinely stopping the scroll)
- Average: 20-30% (competitive but room to improve)
- Weak: Below 20% (your ad is blending into the feed)
Hold Rate Benchmarks (3s to 15s)
- Strong: 30%+ (your content is keeping attention well)
- Average: 15-30% (typical for most ad content)
- Weak: Below 15% (people are dropping off fast after the hook)
Platform-Specific Notes
- Meta (Facebook/Instagram): Reels and Stories tend to have higher hook rates but lower hold rates due to fast-swipe behavior. Feed placements often show the inverse.
- TikTok: Hook rates skew higher because the format is built around quick engagement, but competition for hold rate is fierce.
- YouTube Shorts: Similar dynamics to TikTok. For in-stream pre-roll, hold rate matters more since viewers can skip after 5 seconds.
Industry Variations
- DTC / E-commerce: Hook rates tend to be higher (product visuals grab attention), but hold rates can suffer if the ad feels too promotional too fast.
- SaaS / B2B: Hook rates tend to run lower (less visual novelty), but hold rates can be strong when the content is genuinely educational.
- Entertainment / Media: Naturally high hook and hold rates due to inherently engaging content. Not a fair comparison for other verticals.
How to Improve Hook Rate: Tactics That Work
Every percentage point of hook rate improvement means more people entering your funnel at the same spend. Here are the tactics that consistently move the needle:
- Lead with motion. Static opening frames get scrolled past. Start with movement — a hand reaching into frame, a product being unboxed, a quick zoom.
- Use a pattern interrupt. Something unexpected in the first frame forces the brain to pause. A bold color, an unusual angle, a surprising visual.
- Put text on screen immediately. Don't wait. The first frame should have a text overlay that creates curiosity or states a bold claim.
- Open with a question or confrontation. "You're wasting money on ads" stops a media buyer faster than "Here are five tips for better ads."
- Test hooks independently from the body. Create 5-10 different opening variations for the same ad body. This is the single highest-leverage creative testing strategy.
- Analyze what's working frame by frame. Break down your top-performing hooks to understand exactly which visual and copy elements are driving the thumb-stop. Tools like Glued's Video Analysis Pipeline automate this — using AI to deconstruct video hooks frame by frame, analyzing pacing, structure, and visual composition so you can reverse-engineer what makes a hook land.
How to Improve Hold Rate: Tactics That Work
Getting the stop is step one. Keeping attention long enough to deliver your message is step two. Here's what works:
- Front-load the payoff. Don't save the best for last. Deliver value or intrigue within the first 5 seconds after the hook.
- Use pacing changes. A video that moves at one speed feels monotonous. Alternate between fast cuts and slower moments. Change the visual rhythm every 3-5 seconds.
- Create open loops. Tease something early ("I'll show you the results in a second") that the viewer has to stick around to see resolved.
- Cut ruthlessly. If a section doesn't serve the message, remove it. Most video ads are 20-40% longer than they need to be.
- Add visual variety. Switch angles, locations, or speakers. Talking-head videos with no visual change see steep drop-off curves.
- Match the hook's promise. If your hook implies a reveal, tutorial, or result — deliver it. Mismatched expectations are the number one hold rate killer.
- Use captions and text overlays throughout. Many viewers watch without sound. If your hold rate depends on audio alone, you're losing the silent majority.
Measuring and Optimizing: The Right Tools for the Job
Tracking hook rate and hold rate manually across dozens of creatives is tedious and error-prone. The workflow matters as much as the metrics.
Platform-native analytics give you the raw numbers. Meta Ads Manager, TikTok Ads Manager, and YouTube Analytics all report video view breakdowns at various time intervals. Start here, but don't stop here.
Spreadsheet tracking works at small scale. Export your data, calculate hook and hold rates, and plot them into the diagnostic matrix. This breaks down once you're running 20+ creatives per week.
Dedicated creative analytics platforms are where serious creative teams operate. This is where a tool like Glued fits into the workflow. Glued's Creative Performance Overlay shows spend and ROAS data directly alongside creative thumbnails, so you can visually scan which creatives are performing without jumping between tabs and spreadsheets.
When you identify a "low hook / high hold" creative — the hidden gem scenario — Glued's Hook Variation Generator lets you rapidly produce AI-powered hook alternatives with full variation history. Instead of manually brainstorming and editing new openings, you generate multiple options, test them, and track which variations moved the hook rate.
The combination of frame-level video analysis, performance overlay, and rapid hook generation turns the diagnostic framework from a theory into a repeatable system.

Putting It All Together: A Weekly Creative Review Process
Here's a practical workflow for applying hook rate and hold rate analysis to your creative program:
- Pull metrics weekly. Export or review hook rate and hold rate for every active video creative.
- Plot into the diagnostic matrix. Categorize each creative into one of the four quadrants.
- Prioritize action. Focus on "high hook / low hold" and "low hook / high hold" creatives first — these are the highest-leverage fixes.
- Generate variations. For low-hook creatives, produce new opening variations. For low-hold creatives, restructure the body.
- Launch and measure. Give new variations 3-5 days of data before evaluating. Don't kill tests too early.
- Archive learnings. Document which hook styles, pacing patterns, and structures work for your brand and audience. Build a creative playbook over time.
This process compounds. After a few cycles, you'll develop an intuition for what works before you even see the data — and your hit rate on new concepts will climb.
Final Thoughts
Hook rate and hold rate are not vanity metrics. They are the two most direct measures of whether your creative is doing its job in the feed.
Track them together. Use them to diagnose problems. Build a system for rapid iteration based on what the data tells you.
The creative strategists who win consistently aren't the ones with the best single idea. They're the ones with the best process for finding what works, understanding why it works, and producing more of it.
Want to see your hook and hold rate data alongside AI-powered video analysis and hook generation? [Try Glued](https://glued.me) and bring structure to your creative workflow.